Prometheus监控Springboot程序的实现方法
我本次使用的Springboot版本为1.5.12.RELEASE,如果是Springboot2.0+,那么监控的配置以及吐出的监控指标会有所不同。添加maven依赖,pom文件配置如下:
<dependency> <groupId>io.prometheus</groupId> <artifactId>simpleclient_spring_boot</artifactId> <version>${prometheus.client.version}</version> </dependency> <dependency> <groupId>io.prometheus</groupId> <artifactId>simpleclient</artifactId> <version>${prometheus.client.version}</version> </dependency> <dependency> <groupId>io.prometheus</groupId> <artifactId>simpleclient_hotspot</artifactId> <version>${prometheus.client.version}</version> </dependency>
其中Prometheus的版本号为:
<prometheus.client.version>0.5.0</prometheus.client.version>2. 修改配置文件
修改application.properties配置文件,添加如下内容:
server.port=8080# 启用基础认证security.basic.enabled = false# 安全路径列表,逗号分隔,此处只针对/admin路径进行认证security.basic.path = /admin# 认证使用的用户名security.user.name = admin# 认证使用的密码。 默认情况下,启动时会记录随机密码。security.user.password = 123456# 可以访问管理端点的用户角色列表,逗号分隔management.security.roles = SUPERUSER# actuator暴露接口使用的端口,为了和api接口使用的端口进行分离management.port = 8099# actuator暴露接口的前缀management.context-path = /admin# actuator是否需要安全保证management.security.enabled = false# actuator的metrics接口是否需要安全保证endpoints.metrics.sensitive = false# actuator的metrics接口是否开启endpoints.metrics.enabled=true# actuator的health接口是否需要安全保证endpoints.health.sensitive=false# actuator的health接口是否开启endpoints.health.enabled=true
application.yml 配置如下:
# actuator是否需要安全保证management.security.enabled: falseendpoints: metrics: # actuator的metrics接口是否需要安全保证 sensitive: false # actuator的metrics接口是否开启 enabled: true health: # actuator的health接口是否需要安全保证 sensitive: false # actuator的health接口是否开启 enabled: true3. 启用Prometheus监控
在Springboot启动类上添加注解@EnablePrometheusEndpoint,同时使用simpleclient_hotspot中提供的DefaultExporter该Exporter会在metrics endpoint中放回当前应用JVM的相关信息
@SpringBootApplication@EnablePrometheusEndpoint@EnableSpringBootMetricsCollectorpublic class CaseApplication implements CommandLineRunner { public static void main(String[] args) { SpringApplication.run(CaseApplication.class, args); } @Override public void run(String... strings) throws Exception { DefaultExports.initialize(); }}4. 监控埋点4.1 新建拦截器
建立一个拦截器,用来拦截URL。
public class PrometheusMetricsInterceptor implements HandlerInterceptor { private Histogram.Timer histogramRequestTimer; private Histogram.Timer nacosTimer; private Histogram.Child nacosChild; static final Histogram requestLatencyHistogram = Histogram.build().labelNames('path', 'method', 'code') .name('io_namespace_http_requests_latency_seconds_histogram').help('Request latency in seconds.') .register(); @Override public boolean preHandle(HttpServletRequest request, HttpServletResponse response, Object handler) throws Exception { System.out.println('-------Histogram--------'); histogramRequestTimer = requestLatencyHistogram .labels(request.getRequestURI(), request.getMethod(), String.valueOf(response.getStatus())) .startTimer(); nacosTimer = MetricsMonitor.getConfigRequestMonitor(request.getMethod(), request.getRequestURI(), String.valueOf(response.getStatus())); nacosChild = MetricsMonitor.getNamingRequestMonitor(request.getMethod(), request.getRequestURI(), String.valueOf(response.getStatus())); return true; } @Override public void postHandle(HttpServletRequest request, HttpServletResponse response, Object handler, ModelAndView modelAndView) throws Exception { } @Override public void afterCompletion(HttpServletRequest request, HttpServletResponse response, Object handler, Exception ex) throws Exception { histogramRequestTimer.observeDuration(); nacosTimer.observeDuration(); nacosChild.startTimer(); }}4.2 注册拦截器
新建拦截器后需要注册到服务中才可以拦截URL。
@Configurationpublic class WebServletContextConfiguration extends WebMvcConfigurationSupport { @Override public void addInterceptors(InterceptorRegistry registry) { registry.addInterceptor(getInterceptor()).addPathPatterns('/**'); super.addInterceptors(registry); } @Bean public HandlerInterceptor getInterceptor() { return new PrometheusMetricsInterceptor(); }}5. 验证监控
启动应用程序,访问地址http://localhost:8099/admin/prometheus,验证是否存在监控指标。

普罗米修斯客户端库提供了四种核心度量类型。目前,它们只在客户端库(为了使api能够根据特定类型的使用而定制)和wire协议中有所区别。Prometheus服务器还没有利用类型信息,并将所有数据压缩成无类型的时间序列。这种情况在未来可能会改变。
6.1 Counter计数器是一个累积度量,它表示一个单调递增的计数器,其值在重新启动时只能递增或重置为零。例如,您可以使用计数器来表示服务的请求、完成的任务或错误的数量。不要使用计数器来暴露可能降低的值。例如,不要为当前正在运行的进程的数量使用计数器;而是使用量规。示例代码:
import io.prometheus.client.Counter;class YourClass { static final Counter requests = Counter.build() .name('requests_total').help('Total requests.').register(); void processRequest() { requests.inc(); // Your code here. }}6.2 Gauge
量规是一个度量单位,它表示一个可以任意上下移动的数值。压力表通常用于测量温度或当前内存使用情况等测量值,但也用于“计数”,比如并发请求的数量。示例代码:
class YourClass { static final Gauge inprogressRequests = Gauge.build() .name('inprogress_requests').help('Inprogress requests.').register(); void processRequest() { inprogressRequests.inc(); // Your code here. inprogressRequests.dec(); }}6.3 Histogram
直方图对观察结果(通常是请求持续时间或响应大小之类的东西)进行采样,并在可配置的桶中计数。它还提供所有观测值的和。示例代码:
class YourClass { static final Histogram requestLatency = Histogram.build() .name('requests_latency_seconds').help('Request latency in seconds.').register(); void processRequest(Request req) { Histogram.Timer requestTimer = requestLatency.startTimer(); try { // Your code here. } finally { requestTimer.observeDuration(); } }}6.4 Summary
与柱状图类似,摘要对观察结果进行采样(通常是请求持续时间和响应大小之类的内容)。虽然它还提供了观察值的总数和所有观察值的总和,但它计算了一个滑动时间窗口上的可配置分位数。
class YourClass { static final Summary receivedBytes = Summary.build() .name('requests_size_bytes').help('Request size in bytes.').register(); static final Summary requestLatency = Summary.build() .name('requests_latency_seconds').help('Request latency in seconds.').register(); void processRequest(Request req) { Summary.Timer requestTimer = requestLatency.startTimer(); try { // Your code here. } finally { receivedBytes.observe(req.size()); requestTimer.observeDuration(); } }}6.5 自定义Collector
有时不可能直接测试代码,因为它不在您的控制范围内。这要求您代理来自其他系统的指标。为此,您需要创建一个自定义收集器(需要将其注册为普通度量)。
class YourCustomCollector extends Collector { List<MetricFamilySamples> collect() { List<MetricFamilySamples> mfs = new ArrayList<MetricFamilySamples>(); // With no labels. mfs.add(new GaugeMetricFamily('my_gauge', 'help', 42)); // With labels GaugeMetricFamily labeledGauge = new GaugeMetricFamily('my_other_gauge', 'help', Arrays.asList('labelname')); labeledGauge.addMetric(Arrays.asList('foo'), 4); labeledGauge.addMetric(Arrays.asList('bar'), 5); mfs.add(labeledGauge); return mfs; }}// Registrationstatic final YourCustomCollector requests = new YourCustomCollector().register()7. 安装配置Prometheus7.1 安装配置
下载安装包
wget https://github.com/prometheus/prometheus/releases/download/v2.12.0/prometheus-2.12.0.linux-amd64.tar.gz
解压文件
tar -zxvf prometheus-2.12.0.linux-amd64.tar.gz
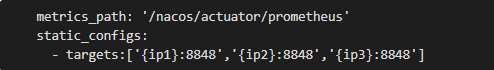
修改配置文件prometheus.yml采集Nacos metrics数据。配置监控的job以及目标服务器,每一个目标服务器都是一个实例。
cd prometheus-*
后台启动Prometheus服务,并出到日志。
./prometheus --config.file=prometheus.yml > prometheus.log 2>&1 &
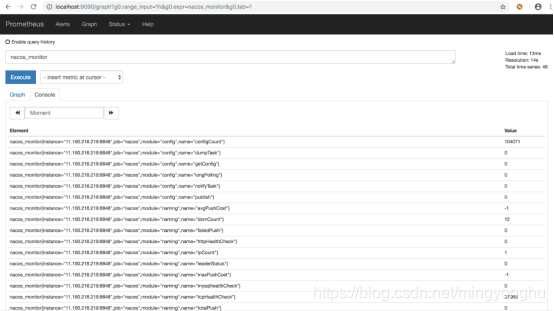
通过访问http://{ip}:9090/graph可以看到prometheus的采集数据,在搜索栏搜索监控指标,例如:nacos_monitor可以搜索到Nacos数据说明采集数据成功
在查询条件框中输入表达式,进行统计。例如:
sum(rate(nacos_client_request_seconds_count{url=~’/dialog/slu/nlp/parser’, instance=~’39.97.161.102:30315|39.97.161.102:30316’}[1m])) by (method,url,instance)
结果如下图:

安装grafana,下载安装包
wget https://dl.grafana.com/oss/release/grafana-6.5.2.linux-amd64.tar.gztar -zxvf grafana-6.5.2.linux-amd64.tar.gz
修改端口配置,复制一个配置文件,后续修改基于该自定义配置文件修改,不需要修改原始文件。
cd grafana-6.5.2/confcp sample.ini custom.inivi custom.ini
可以在该配置文件中修改端口号

访问grafana: http://{ip}:3000,用户名密码默认为:admin/admin。

登录时提示修改默认密码,如果不想修改可以跳过。
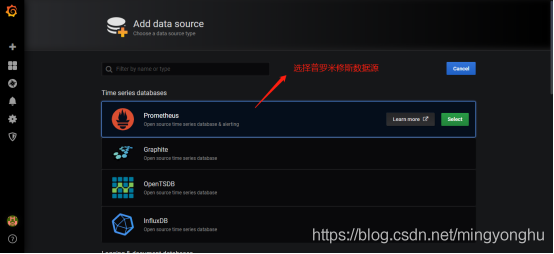
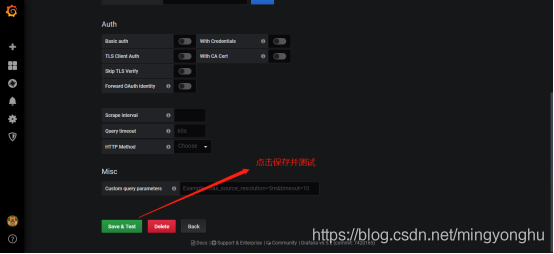
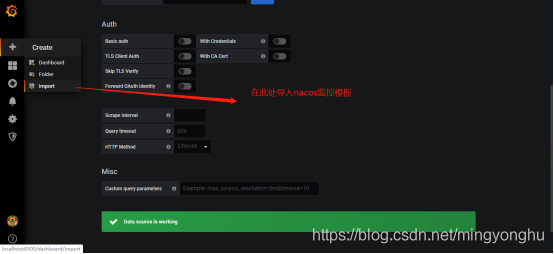
8.2 配置数据源

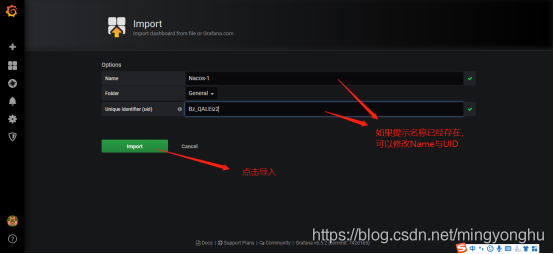
监控面板可以自己配置,也可以通过导入json文件来进行修改,推荐使用配置好的json文件,修改起来会非常方便。

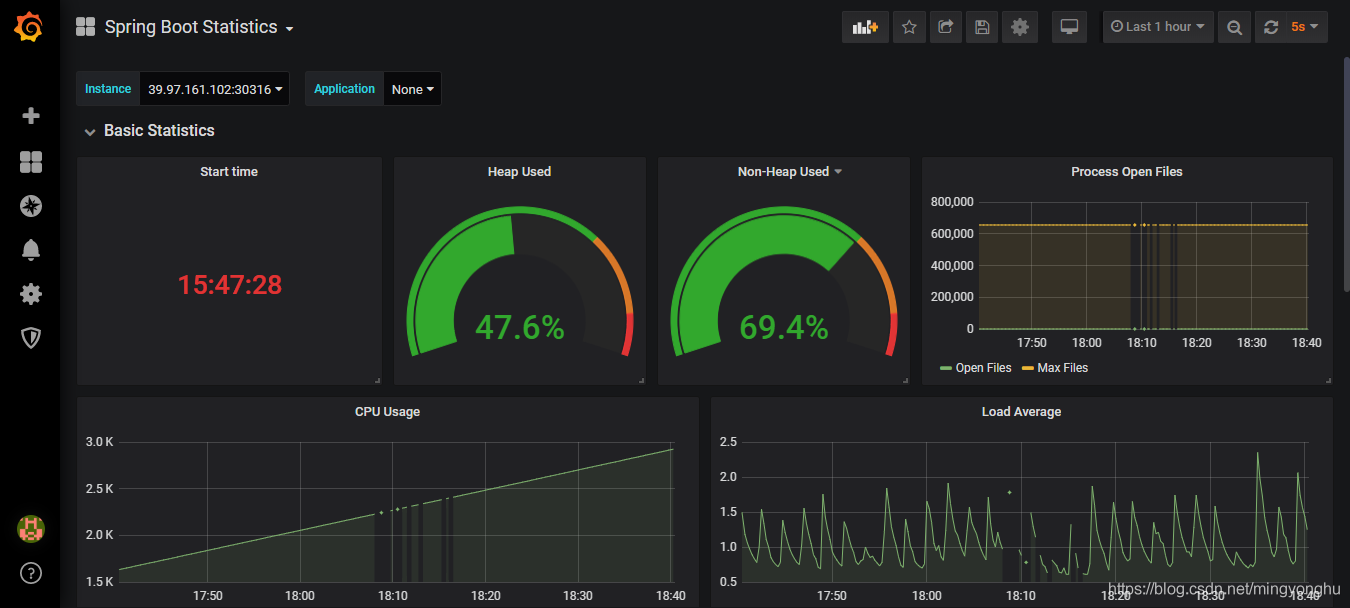
修改后的展示效果如图所示:
注:此处grafana的模板文件是从别处下载的,可以根据需要导入自己的模板文件。
9. 参考文献SpringBoot 应用监控踩坑集锦
prometheus docs
到此这篇关于Prometheus监控Springboot程序的实现方法的文章就介绍到这了,更多相关Prometheus监控Springboot内容请搜索好吧啦网以前的文章或继续浏览下面的相关文章希望大家以后多多支持好吧啦网!
相关文章:
 网公网安备
网公网安备