python中用ggplot绘制画图实例讲解
Python的绘图库也允许用户创建优雅的图形,本章给大家介绍的是关于ggplot绘制画图的技巧,ggplot2建立在grid系统上,这个系统不支持纹理。需要额外创建一堆数据,再基于这些数据构建一个geom_path图层,盖在柱图上才可以进行各种绘制,下面给大家详细讲解下怎么使用ggplot绘图。
简介:ggplot类是在plotnine中的,能够生成一个图形。
安装:pip install pandas plotnine
csv文件加载到survs_df的数据框架:
ggplot(survs_df, aes(x=’weight’, y=’hindfoot_length’,size = ’year’)) + geom_point()生成图形步骤:
1、设置数据框
2、需要将数据框架转换成位置、颜色、大小等
3、显示实际图形元素
实例代码:
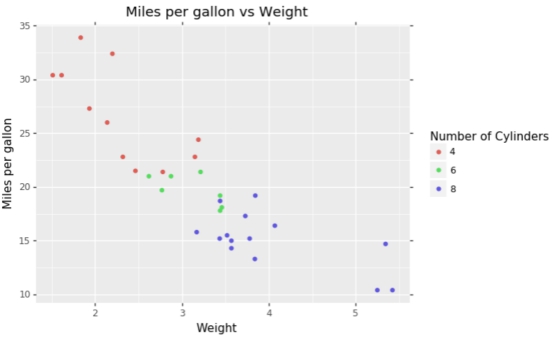
(ggplot(mtcars, aes(‘wt’, ‘mpg’, color=’factor(cyl)’))+ geom_point()+ labs(title=’Miles per gallon vs Weight’, x=’Weight’, y=’Miles per gallon’)+ guides(color=guide_legend(title=’Number of Cylinders’)) )
输出效果:

知识点扩展:
绘制散点图,geom_point()
读取外部数据进行绘图
>>> import pandas as pd>>> from ggplot import *>>> df=pd.read_table(’C:UserslenovoDesktopmtcars.txt’)>>> df··name type number volume size other0 td T 96 3 20 c1 sf F 87 5 65 c2 cc F 79 9 80 d
如果读取的数据没有column可以添加
df.columns=[’name’,’type’,’number’,’volume’,’size’,’other’]>>> p=ggplot(df, aes(x=’number’, y=’volume’, size=’factor(size)’, color=’factor(other)’))+geom_point()>>> print p
到此这篇关于python中用ggplot绘制画图实例讲解的文章就介绍到这了,更多相关python中ggplot怎么绘制画图内容请搜索好吧啦网以前的文章或继续浏览下面的相关文章希望大家以后多多支持好吧啦网!
相关文章:
 网公网安备
网公网安备