zabbix监控Nginx/Tomcat/MySQL的详细教程
目录
- zabbix监控Nginx
- zabbix监控Tomcat
- zabbix监控MySQL
zabbix监控Nginx
A机器:zabbix服务端(192.168.234.128) B机器:zabbix客户端(192.168.234.125)
在B机器(zabbix客户端)操作:
编辑nginx虚拟主机配置文件:
[root@centos ~]# vi /etc/nginx/conf.d/default.conf
在server{}中添加以下内容:
location /nginx_status { stub_status on; access_log off; allow 127.0.0.1; deny all; }重载nginx配置:
[root@centos ~]# nginx -s reload
测试:
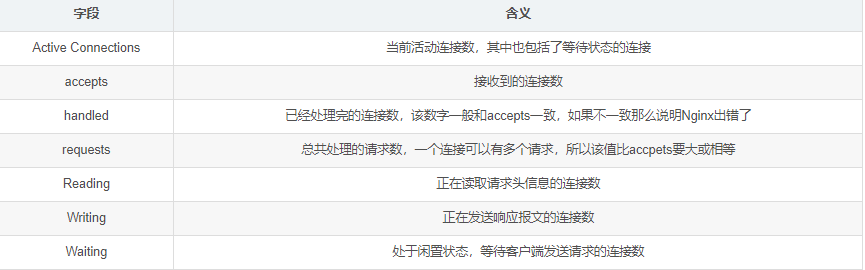
[root@centos ~]# curl http://127.0.0.1/nginx_statusActive connections: 1 server accepts handled requests 3 3 3 Reading: 0 Writing: 1 Waiting: 0
#nginx状态信息已显示
状态说明:
添加监控脚本:
vi /usr/local/sbin/ngx_status.sh
添加以下内容:
#!/bin/bashurl="http://127.0.0.1/nginx_status"curl=/usr/bin/curl# 检测nginx进程是否存在function ping { /sbin/pidof nginx | wc -l }# 检测nginx性能function active { $curl $url 2>/dev/null| grep "Active" | awk "{print $NF}"}function reading { $curl $url 2>/dev/null| grep "Reading" | awk "{print $2}"}function writing { $curl $url 2>/dev/null| grep "Writing" | awk "{print $4}"}function waiting { $curl $url 2>/dev/null| grep "Waiting" | awk "{print $6}"}function accepts { $curl $url 2>/dev/null| awk NR==3 | awk "{print $1}"}function handled { $curl $url 2>/dev/null| awk NR==3 | awk "{print $2}"}function requests { $curl $url 2>/dev/null| awk NR==3 | awk "{print $3}"}$1添加权限:
[root@centos ~]# chmod 755 /usr/local/sbin/ngx_status.sh
编辑zabbix_agent配置文件:
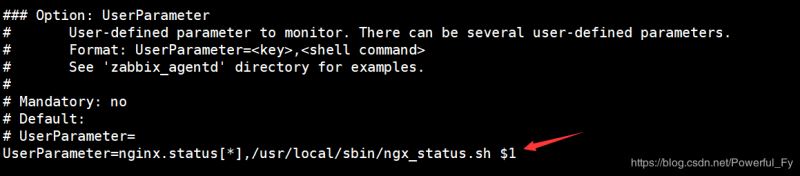
[root@centos ~]# vi /etc/zabbix/zabbix_agentd.conf
在Option:UserParameter处添加:UserParameter=nginx.status[*],/usr/local/sbin/ngx_status.sh $1
重启服务:
[root@centos ~]# systemctl restart zabbix-agent
在A机器(服务端)测试:
[root@zabbix ~]# zabbix_get -s 192.168.234.125 -k "nginx.status[accepts]"6
在本机创建.xml文件并添加以下内容:(文件名称自定义)
<?xml version="1.0" encoding="UTF-8"?><zabbix_export> <version>4.0</version> <date>2019-02-11T07:29:29Z</date> <groups> <group> <name>Templates</name> </group> </groups> <templates> <template> <template>Template App NGINX</template> <name>Template App NGINX</name> <description/> <groups> <group> <name>Templates</name> </group> </groups> <applications> <application> <name>nginx</name> </application> </applications> <items> <item> <name>nginx status server accepts</name> <type>0</type> <snmp_community/> <snmp_oid/> <key>nginx.status[accepts]</key> <delay>60</delay> <history>90d</history> <trends>365d</trends> <status>0</status> <value_type>3</value_type> <allowed_hosts/> <units/> <snmpv3_contextname/> <snmpv3_securityname/> <snmpv3_securitylevel>0</snmpv3_securitylevel> <snmpv3_authprotocol>0</snmpv3_authprotocol> <snmpv3_authpassphrase/> <snmpv3_privprotocol>0</snmpv3_privprotocol> <snmpv3_privpassphrase/> <params/> <ipmi_sensor/> <authtype>0</authtype> <username/> <password/> <publickey/> <privatekey/> <port/> <description>accepts</description> <inventory_link>0</inventory_link> <applications> <application> <name>nginx</name> </application> </applications> <valuemap/> <logtimefmt/> <preprocessing> <step> <type>10</type> <params/> </step> </preprocessing> <jmx_endpoint/> <timeout>3s</timeout> <url/> <query_fields/> <posts/> <status_codes>200</status_codes> <follow_redirects>1</follow_redirects> <post_type>0</post_type> <http_proxy/> <headers/> <retrieve_mode>0</retrieve_mode> <request_method>0</request_method> <output_format>0</output_format> <allow_traps>0</allow_traps> <ssl_cert_file/> <ssl_key_file/> <ssl_key_password/> <verify_peer>0</verify_peer> <verify_host>0</verify_host> <master_item/> </item> <item> <name>nginx status connections active</name> <type>0</type> <snmp_community/> <snmp_oid/> <key>nginx.status[active]</key> <delay>60</delay> <history>90d</history> <trends>365d</trends> <status>0</status> <value_type>3</value_type> <allowed_hosts/> <units/> <snmpv3_contextname/> <snmpv3_securityname/> <snmpv3_securitylevel>0</snmpv3_securitylevel> <snmpv3_authprotocol>0</snmpv3_authprotocol> <snmpv3_authpassphrase/> <snmpv3_privprotocol>0</snmpv3_privprotocol> <snmpv3_privpassphrase/> <params/> <ipmi_sensor/> <authtype>0</authtype> <username/> <password/> <publickey/> <privatekey/> <port/> <description>active</description> <inventory_link>0</inventory_link> <applications> <application> <name>nginx</name> </application> </applications> <valuemap/> <logtimefmt/> <preprocessing/> <jmx_endpoint/> <timeout>3s</timeout> <url/> <query_fields/> <posts/> <status_codes>200</status_codes> <follow_redirects>1</follow_redirects> <post_type>0</post_type> <http_proxy/> <headers/> <retrieve_mode>0</retrieve_mode> <request_method>0</request_method> <output_format>0</output_format> <allow_traps>0</allow_traps> <ssl_cert_file/> <ssl_key_file/> <ssl_key_password/> <verify_peer>0</verify_peer> <verify_host>0</verify_host> <master_item/> </item> <item> <name>nginx status server handled</name> <type>0</type> <snmp_community/> <snmp_oid/> <key>nginx.status[handled]</key> <delay>60</delay> <history>90d</history> <trends>365d</trends> <status>0</status> <value_type>3</value_type> <allowed_hosts/> <units/> <snmpv3_contextname/> <snmpv3_securityname/> <snmpv3_securitylevel>0</snmpv3_securitylevel> <snmpv3_authprotocol>0</snmpv3_authprotocol> <snmpv3_authpassphrase/> <snmpv3_privprotocol>0</snmpv3_privprotocol> <snmpv3_privpassphrase/> <params/> <ipmi_sensor/> <authtype>0</authtype> <username/> <password/> <publickey/> <privatekey/> <port/> <description>handled</description> <inventory_link>0</inventory_link> <applications> <application> <name>nginx</name> </application> </applications> <valuemap/> <logtimefmt/> <preprocessing> <step> <type>10</type> <params/> </step> </preprocessing> <jmx_endpoint/> <timeout>3s</timeout> <url/> <query_fields/> <posts/> <status_codes>200</status_codes> <follow_redirects>1</follow_redirects> <post_type>0</post_type> <http_proxy/> <headers/> <retrieve_mode>0</retrieve_mode> <request_method>0</request_method> <output_format>0</output_format> <allow_traps>0</allow_traps> <ssl_cert_file/> <ssl_key_file/> <ssl_key_password/> <verify_peer>0</verify_peer> <verify_host>0</verify_host> <master_item/> </item> <item> <name>nginx status PING</name> <type>0</type> <snmp_community/> <snmp_oid/> <key>nginx.status[ping]</key> <delay>60</delay> <history>30d</history> <trends>365d</trends> <status>0</status> <value_type>3</value_type> <allowed_hosts/> <units/> <snmpv3_contextname/> <snmpv3_securityname/> <snmpv3_securitylevel>0</snmpv3_securitylevel> <snmpv3_authprotocol>0</snmpv3_authprotocol> <snmpv3_authpassphrase/> <snmpv3_privprotocol>0</snmpv3_privprotocol> <snmpv3_privpassphrase/> <params/> <ipmi_sensor/> <authtype>0</authtype> <username/> <password/> <publickey/> <privatekey/> <port/> <description>is live</description> <inventory_link>0</inventory_link> <applications> <application> <name>nginx</name> </application> </applications> <valuemap> <name>Service state</name> </valuemap> <logtimefmt/> <preprocessing/> <jmx_endpoint/> <timeout>3s</timeout> <url/> <query_fields/> <posts/> <status_codes>200</status_codes> <follow_redirects>1</follow_redirects> <post_type>0</post_type> <http_proxy/> <headers/> <retrieve_mode>0</retrieve_mode> <request_method>0</request_method> <output_format>0</output_format> <allow_traps>0</allow_traps> <ssl_cert_file/> <ssl_key_file/> <ssl_key_password/> <verify_peer>0</verify_peer> <verify_host>0</verify_host> <master_item/> </item> <item> <name>nginx status connections reading</name> <type>0</type> <snmp_community/> <snmp_oid/> <key>nginx.status[reading]</key> <delay>60</delay> <history>90d</history> <trends>365d</trends> <status>0</status> <value_type>3</value_type> <allowed_hosts/> <units/> <snmpv3_contextname/> <snmpv3_securityname/> <snmpv3_securitylevel>0</snmpv3_securitylevel> <snmpv3_authprotocol>0</snmpv3_authprotocol> <snmpv3_authpassphrase/> <snmpv3_privprotocol>0</snmpv3_privprotocol> <snmpv3_privpassphrase/> <params/> <ipmi_sensor/> <authtype>0</authtype> <username/> <password/> <publickey/> <privatekey/> <port/> <description>reading</description> <inventory_link>0</inventory_link> <applications> <application> <name>nginx</name> </application> </applications> <valuemap/> <logtimefmt/> <preprocessing/> <jmx_endpoint/> <timeout>3s</timeout> <url/> <query_fields/> <posts/> <status_codes>200</status_codes> <follow_redirects>1</follow_redirects> <post_type>0</post_type> <http_proxy/> <headers/> <retrieve_mode>0</retrieve_mode> <request_method>0</request_method> <output_format>0</output_format> <allow_traps>0</allow_traps> <ssl_cert_file/> <ssl_key_file/> <ssl_key_password/> <verify_peer>0</verify_peer> <verify_host>0</verify_host> <master_item/> </item> <item> <name>nginx status server requests</name> <type>0</type> <snmp_community/> <snmp_oid/> <key>nginx.status[requests]</key> <delay>60</delay> <history>90d</history> <trends>365d</trends> <status>0</status> <value_type>3</value_type> <allowed_hosts/> <units/> <snmpv3_contextname/> <snmpv3_securityname/> <snmpv3_securitylevel>0</snmpv3_securitylevel> <snmpv3_authprotocol>0</snmpv3_authprotocol> <snmpv3_authpassphrase/> <snmpv3_privprotocol>0</snmpv3_privprotocol> <snmpv3_privpassphrase/> <params/> <ipmi_sensor/> <authtype>0</authtype> <username/> <password/> <publickey/> <privatekey/> <port/> <description>requests</description> <inventory_link>0</inventory_link> <applications> <application> <name>nginx</name> </application> </applications> <valuemap/> <logtimefmt/> <preprocessing> <step> <type>10</type> <params/> </step> </preprocessing> <jmx_endpoint/> <timeout>3s</timeout> <url/> <query_fields/> <posts/> <status_codes>200</status_codes> <follow_redirects>1</follow_redirects> <post_type>0</post_type> <http_proxy/> <headers/> <retrieve_mode>0</retrieve_mode> <request_method>0</request_method> <output_format>0</output_format> <allow_traps>0</allow_traps> <ssl_cert_file/> <ssl_key_file/> <ssl_key_password/> <verify_peer>0</verify_peer> <verify_host>0</verify_host> <master_item/> </item> <item> <name>nginx status connections waiting</name> <type>0</type> <snmp_community/> <snmp_oid/> <key>nginx.status[waiting]</key> <delay>60</delay> <history>90d</history> <trends>365d</trends> <status>0</status> <value_type>3</value_type> <allowed_hosts/> <units/> <snmpv3_contextname/> <snmpv3_securityname/> <snmpv3_securitylevel>0</snmpv3_securitylevel> <snmpv3_authprotocol>0</snmpv3_authprotocol> <snmpv3_authpassphrase/> <snmpv3_privprotocol>0</snmpv3_privprotocol> <snmpv3_privpassphrase/> <params/> <ipmi_sensor/> <authtype>0</authtype> <username/> <password/> <publickey/> <privatekey/> <port/> <description>waiting</description> <inventory_link>0</inventory_link> <applications> <application> <name>nginx</name> </application> </applications> <valuemap/> <logtimefmt/> <preprocessing/> <jmx_endpoint/> <timeout>3s</timeout> <url/> <query_fields/> <posts/> <status_codes>200</status_codes> <follow_redirects>1</follow_redirects> <post_type>0</post_type> <http_proxy/> <headers/> <retrieve_mode>0</retrieve_mode> <request_method>0</request_method> <output_format>0</output_format> <allow_traps>0</allow_traps> <ssl_cert_file/> <ssl_key_file/> <ssl_key_password/> <verify_peer>0</verify_peer> <verify_host>0</verify_host> <master_item/> </item> <item> <name>nginx status connections writing</name> <type>0</type> <snmp_community/> <snmp_oid/> <key>nginx.status[writing]</key> <delay>60</delay> <history>90d</history> <trends>365d</trends> <status>0</status> <value_type>3</value_type> <allowed_hosts/> <units/> <snmpv3_contextname/> <snmpv3_securityname/> <snmpv3_securitylevel>0</snmpv3_securitylevel> <snmpv3_authprotocol>0</snmpv3_authprotocol> <snmpv3_authpassphrase/> <snmpv3_privprotocol>0</snmpv3_privprotocol> <snmpv3_privpassphrase/> <params/> <ipmi_sensor/> <authtype>0</authtype> <username/> <password/> <publickey/> <privatekey/> <port/> <description>writing</description> <inventory_link>0</inventory_link> <applications> <application> <name>nginx</name> </application> </applications> <valuemap/> <logtimefmt/> <preprocessing/> <jmx_endpoint/> <timeout>3s</timeout> <url/> <query_fields/> <posts/> <status_codes>200</status_codes> <follow_redirects>1</follow_redirects> <post_type>0</post_type> <http_proxy/> <headers/> <retrieve_mode>0</retrieve_mode> <request_method>0</request_method> <output_format>0</output_format> <allow_traps>0</allow_traps> <ssl_cert_file/> <ssl_key_file/> <ssl_key_password/> <verify_peer>0</verify_peer> <verify_host>0</verify_host> <master_item/> </item> </items> <discovery_rules/> <httptests/> <macros/> <templates/> <screens/> </template> </templates> <triggers> <trigger> <expression>{Template App NGINX:nginx.status[ping].last()}=0</expression> <recovery_mode>0</recovery_mode> <recovery_expression/> <name>nginx was down!</name> <correlation_mode>0</correlation_mode> <correlation_tag/> <url/> <status>0</status> <priority>4</priority> <description>NGINX进程数:0,请注意</description> <type>0</type> <manual_close>0</manual_close> <dependencies/> <tags/> </trigger> </triggers> <graphs> <graph> <name>nginx status connections</name> <width>900</width> <height>200</height> <yaxismin>0.0000</yaxismin> <yaxismax>100.0000</yaxismax> <show_work_period>1</show_work_period> <show_triggers>1</show_triggers> <type>0</type> <show_legend>1</show_legend> <show_3d>0</show_3d> <percent_left>0.0000</percent_left> <percent_right>0.0000</percent_right> <ymin_type_1>0</ymin_type_1> <ymax_type_1>0</ymax_type_1> <ymin_item_1>0</ymin_item_1> <ymax_item_1>0</ymax_item_1> <graph_items> <graph_item> <sortorder>0</sortorder> <drawtype>0</drawtype> <color>00C800</color> <yaxisside>0</yaxisside> <calc_fnc>2</calc_fnc> <type>0</type> <item> <host>Template App NGINX</host> <key>nginx.status[active]</key> </item> </graph_item> <graph_item> <sortorder>1</sortorder> <drawtype>0</drawtype> <color>C80000</color> <yaxisside>0</yaxisside> <calc_fnc>2</calc_fnc> <type>0</type> <item> <host>Template App NGINX</host> <key>nginx.status[reading]</key> </item> </graph_item> <graph_item> <sortorder>2</sortorder> <drawtype>0</drawtype> <color>0000C8</color> <yaxisside>0</yaxisside> <calc_fnc>2</calc_fnc> <type>0</type> <item> <host>Template App NGINX</host> <key>nginx.status[waiting]</key> </item> </graph_item> <graph_item> <sortorder>3</sortorder> <drawtype>0</drawtype> <color>C800C8</color> <yaxisside>0</yaxisside> <calc_fnc>2</calc_fnc> <type>0</type> <item> <host>Template App NGINX</host> <key>nginx.status[writing]</key> </item> </graph_item> </graph_items> </graph> <graph> <name>nginx status server</name> <width>900</width> <height>200</height> <yaxismin>0.0000</yaxismin> <yaxismax>100.0000</yaxismax> <show_work_period>1</show_work_period> <show_triggers>1</show_triggers> <type>0</type> <show_legend>1</show_legend> <show_3d>0</show_3d> <percent_left>0.0000</percent_left> <percent_right>0.0000</percent_right> <ymin_type_1>0</ymin_type_1> <ymax_type_1>0</ymax_type_1> <ymin_item_1>0</ymin_item_1> <ymax_item_1>0</ymax_item_1> <graph_items> <graph_item> <sortorder>0</sortorder> <drawtype>0</drawtype> <color>00C800</color> <yaxisside>0</yaxisside> <calc_fnc>2</calc_fnc> <type>0</type> <item> <host>Template App NGINX</host> <key>nginx.status[accepts]</key> </item> </graph_item> <graph_item> <sortorder>1</sortorder> <drawtype>0</drawtype> <color>C80000</color> <yaxisside>0</yaxisside> <calc_fnc>2</calc_fnc> <type>0</type> <item> <host>Template App NGINX</host> <key>nginx.status[handled]</key> </item> </graph_item> <graph_item> <sortorder>2</sortorder> <drawtype>0</drawtype> <color>0000C8</color> <yaxisside>0</yaxisside> <calc_fnc>2</calc_fnc> <type>0</type> <item> <host>Template App NGINX</host> <key>nginx.status[requests]</key> </item> </graph_item> </graph_items> </graph> </graphs> <value_maps> <value_map> <name>Service state</name> <mappings> <mapping> <value>0</value> <newvalue>Down</newvalue> </mapping> <mapping> <value>1</value> <newvalue>Up</newvalue> </mapping> </mappings> </value_map> </value_maps></zabbix_export>在zabbix前端页面点击配置→模板→导入:
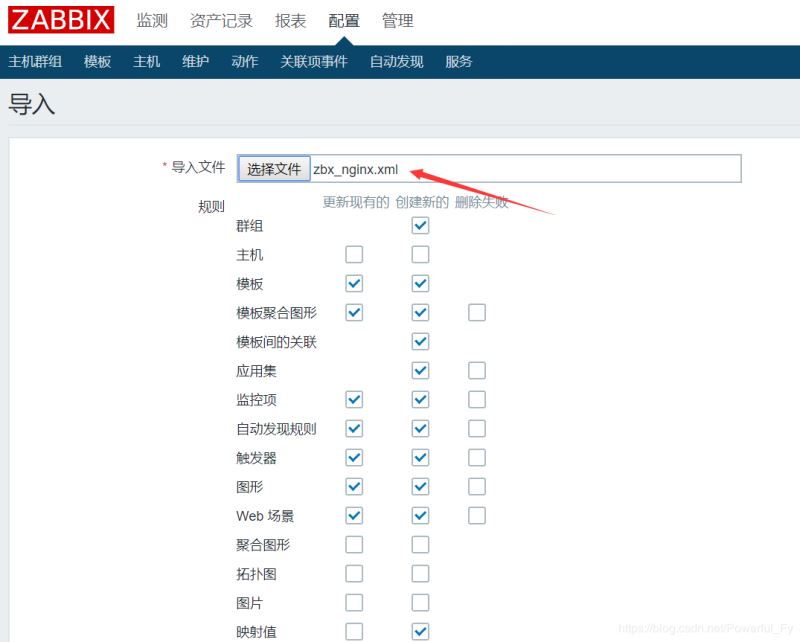
#导入刚才创建的xml文件即可
导入成功后在主机列表页面选择被监控的机器(B机器)链接该模板即可开始监控nginx
zabbix监控Tomcat
A机器:zabbix服务端(192.168.234.128) B机器:zabbix客户端(192.168.234.125)
在A机器安装zabbix-java-gateway:
[root@zabbix ~]# wget https://mirrors.tuna.tsinghua.edu.cn/zabbix/zabbix/4.0/rhel/7/x86_64/zabbix-java-gateway-4.0.14-1.el7.x86_64.rpm[root@zabbix ~]# yum -y localinstall zabbix-java-gateway-4.0.14-1.el7.x86_64.rpm
编辑gateway配置文件:
[root@zabbix ~]# vi /etc/zabbix/zabbix_java_gateway.conf
去掉LISTEN_IP、LISTEN_PORT(监听端口)、START_POLLERS(进程数)的注释符号#:
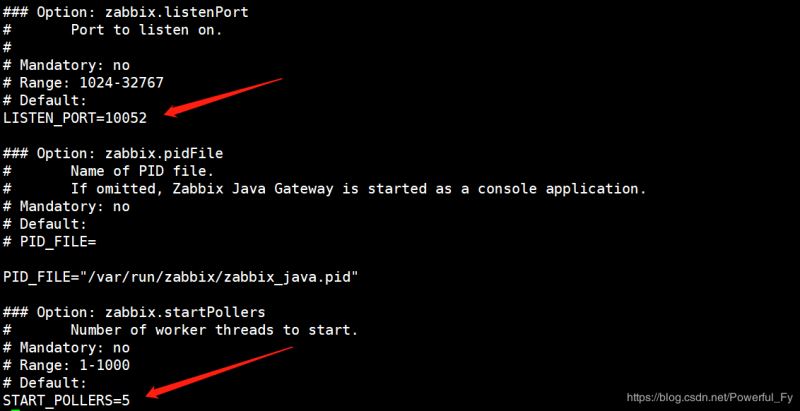
#LISTEN_IP定义被监控机器的地址,不指定默认监听全部机器
编辑server配置文件:
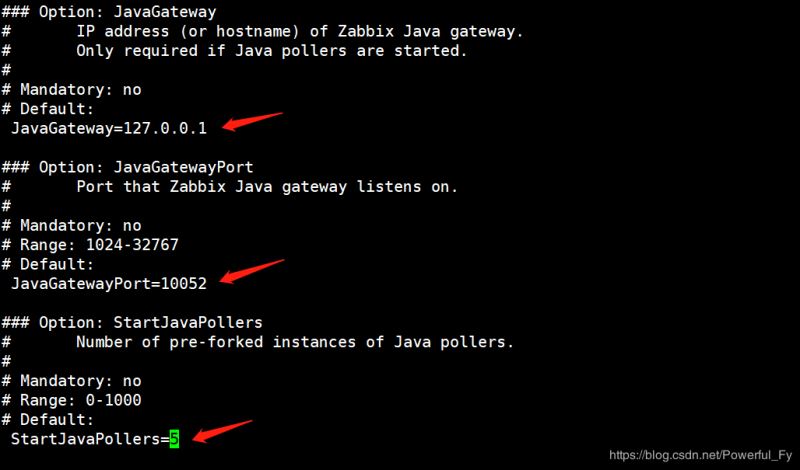
[root@zabbix ~]# vi /etc/zabbix/zabbix_server.conf
定义以下3个配置参数:
启动zabbix-java-gateway服务:
[root@zabbix ~]# systemctl start zabbix-java-gateway
重启zabbix-server服务:
[root@zabbix ~]# systemctl restart zabbix-server
查看监听端口:
[root@zabbix ~]# netstat -lntp |grep javatcp6 0 0 :::10052 :::* LISTEN 8706/java
开启JMX
在B机器编辑tomcat配置文件:
[root@centos ~]# vi /usr/local/tomcat/bin/catalina.sh
添加以下内容:
export CATALINA_OPTS="$CATALINA_OPTS -Dcom.sun.management.jmxremote-Djava.rmi.server.hostname=192.168.234.125-Dcom.sun.management.jmxremote.port=9999-Dcom.sun.management.jmxremote.ssl=false-Dcom.sun.management.jmxremote.authenticate=false"
#hostname定义B机器地址,端口9999(默认12345)
重启tomcat:
[root@centos ~]# /usr/local/tomcat/bin/shutdown.sh [root@centos ~]# /usr/local/tomcat/bin/startup.sh
查看监听端口9999:
[root@centos ~]# netstat -lntp |grep 9999tcp6 0 0 :::9999 :::* LISTEN 25861/java
进入zabbix前端页面添加主机:
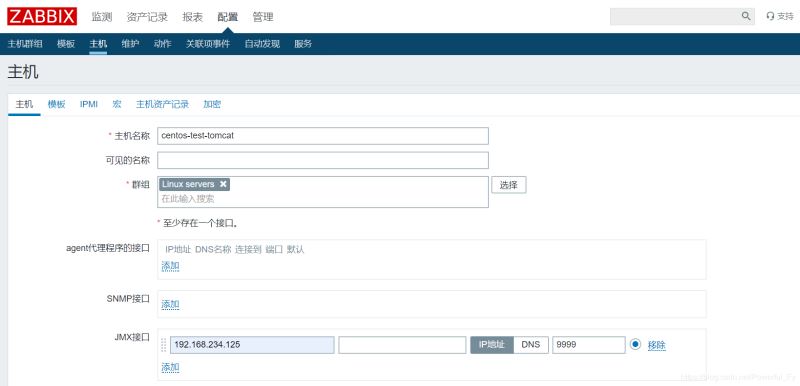
#与普通情况添加监控主机不同,监控B机器的tomcat需要配置JMX接口
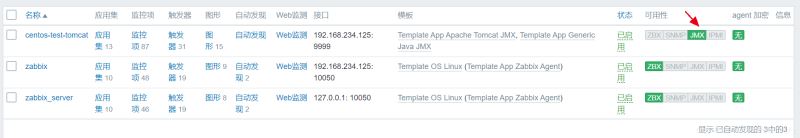
模板链接JMX相关的两个模板:

当JMX图标变绿即表示配置成功:
zabbix监控MySQL
A机器:zabbix服务端(192.168.234.128) B机器:zabbix客户端(192.168.234.125)
zabbix_agent定义mysql监控的配置文件:/etc/zabbix/zabbix_agentd.d/userparameter_mysql.conf
在B机器登录mysql创建用户:
mysql> grant usage,process,replication client on *.* to zamysql@"localhost" identified by "zamysql";
创建配置文件指定的目录:
[root@centos ~]# mkdir /var/lib/zabbix
创建my.cnf文件:
[root@centos ~]# vi /var/lib/zabbix/.my.cnf
#需要注意该文件是隐藏文件
添加以下内容:
[mysql]host=localhostuser=zamysqlpassword="zamysql"socket=/tmp/mysql.sock[mysqladmin]host=localhostuser=zamysqlpassword="zamysql"socket=/tmp/mysql.sock
在A机器测试:
[root@zabbix ~]# zabbix_get -s 192.168.234.125 -p 10050 -k mysql.ping1[root@zabbix ~]# zabbix_get -s 192.168.234.125 -p 10050 -k mysql.versionmysql Ver 14.14 Distrib 5.6.43, for linux-glibc2.12 (x86_64) using EditLine wrapper[root@zabbix ~]# zabbix_get -s 192.168.234.125 -p 10050 -k mysql.size10240
#已成功获取数据
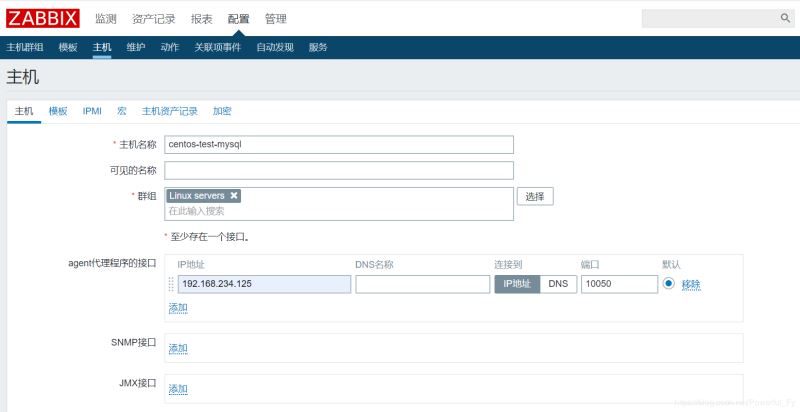
在zabbix前端页面添加主机:
监控模板选择DB mysql:
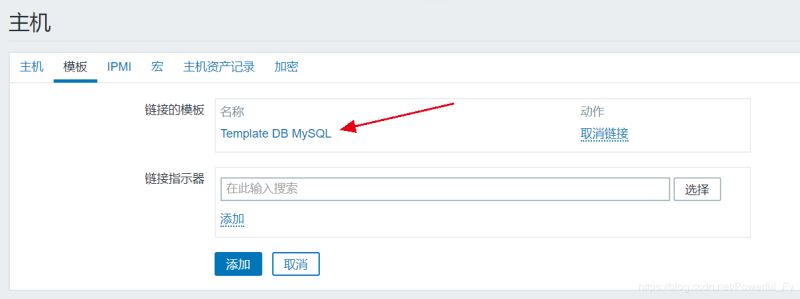
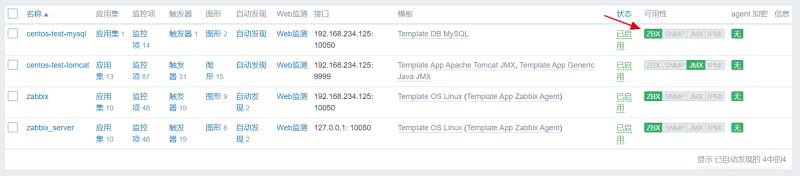
ZBX标准变为绿色表示成功:
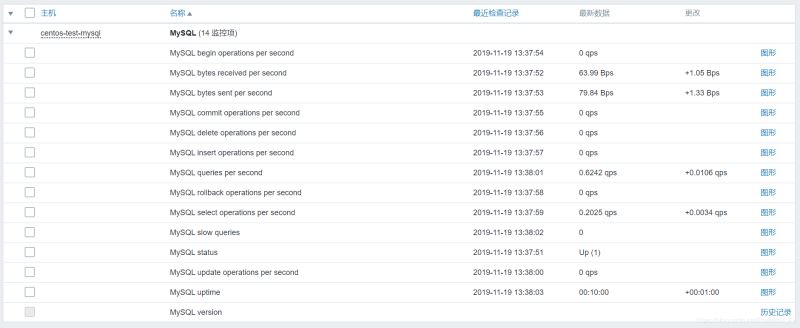
在监测→最新数据页面即可查看mysql监控数据:
总结
以上所述是小编给大家介绍的zabbix监控Nginx/Tomcat/MySQL的详细教程,希望对大家有所帮助,如果大家有任何疑问请给我留言,小编会及时回复大家的。在此也非常感谢大家对网站的支持!如果你觉得本文对你有帮助,欢迎转载,烦请注明出处,谢谢!
相关文章:

 网公网安备
网公网安备